 Chorium
Docs/The Dashboard
The Dashboard
The board is where you watch the whole fleet. This page explains everything you see there so you can tell, at a glance, which agent needs you.
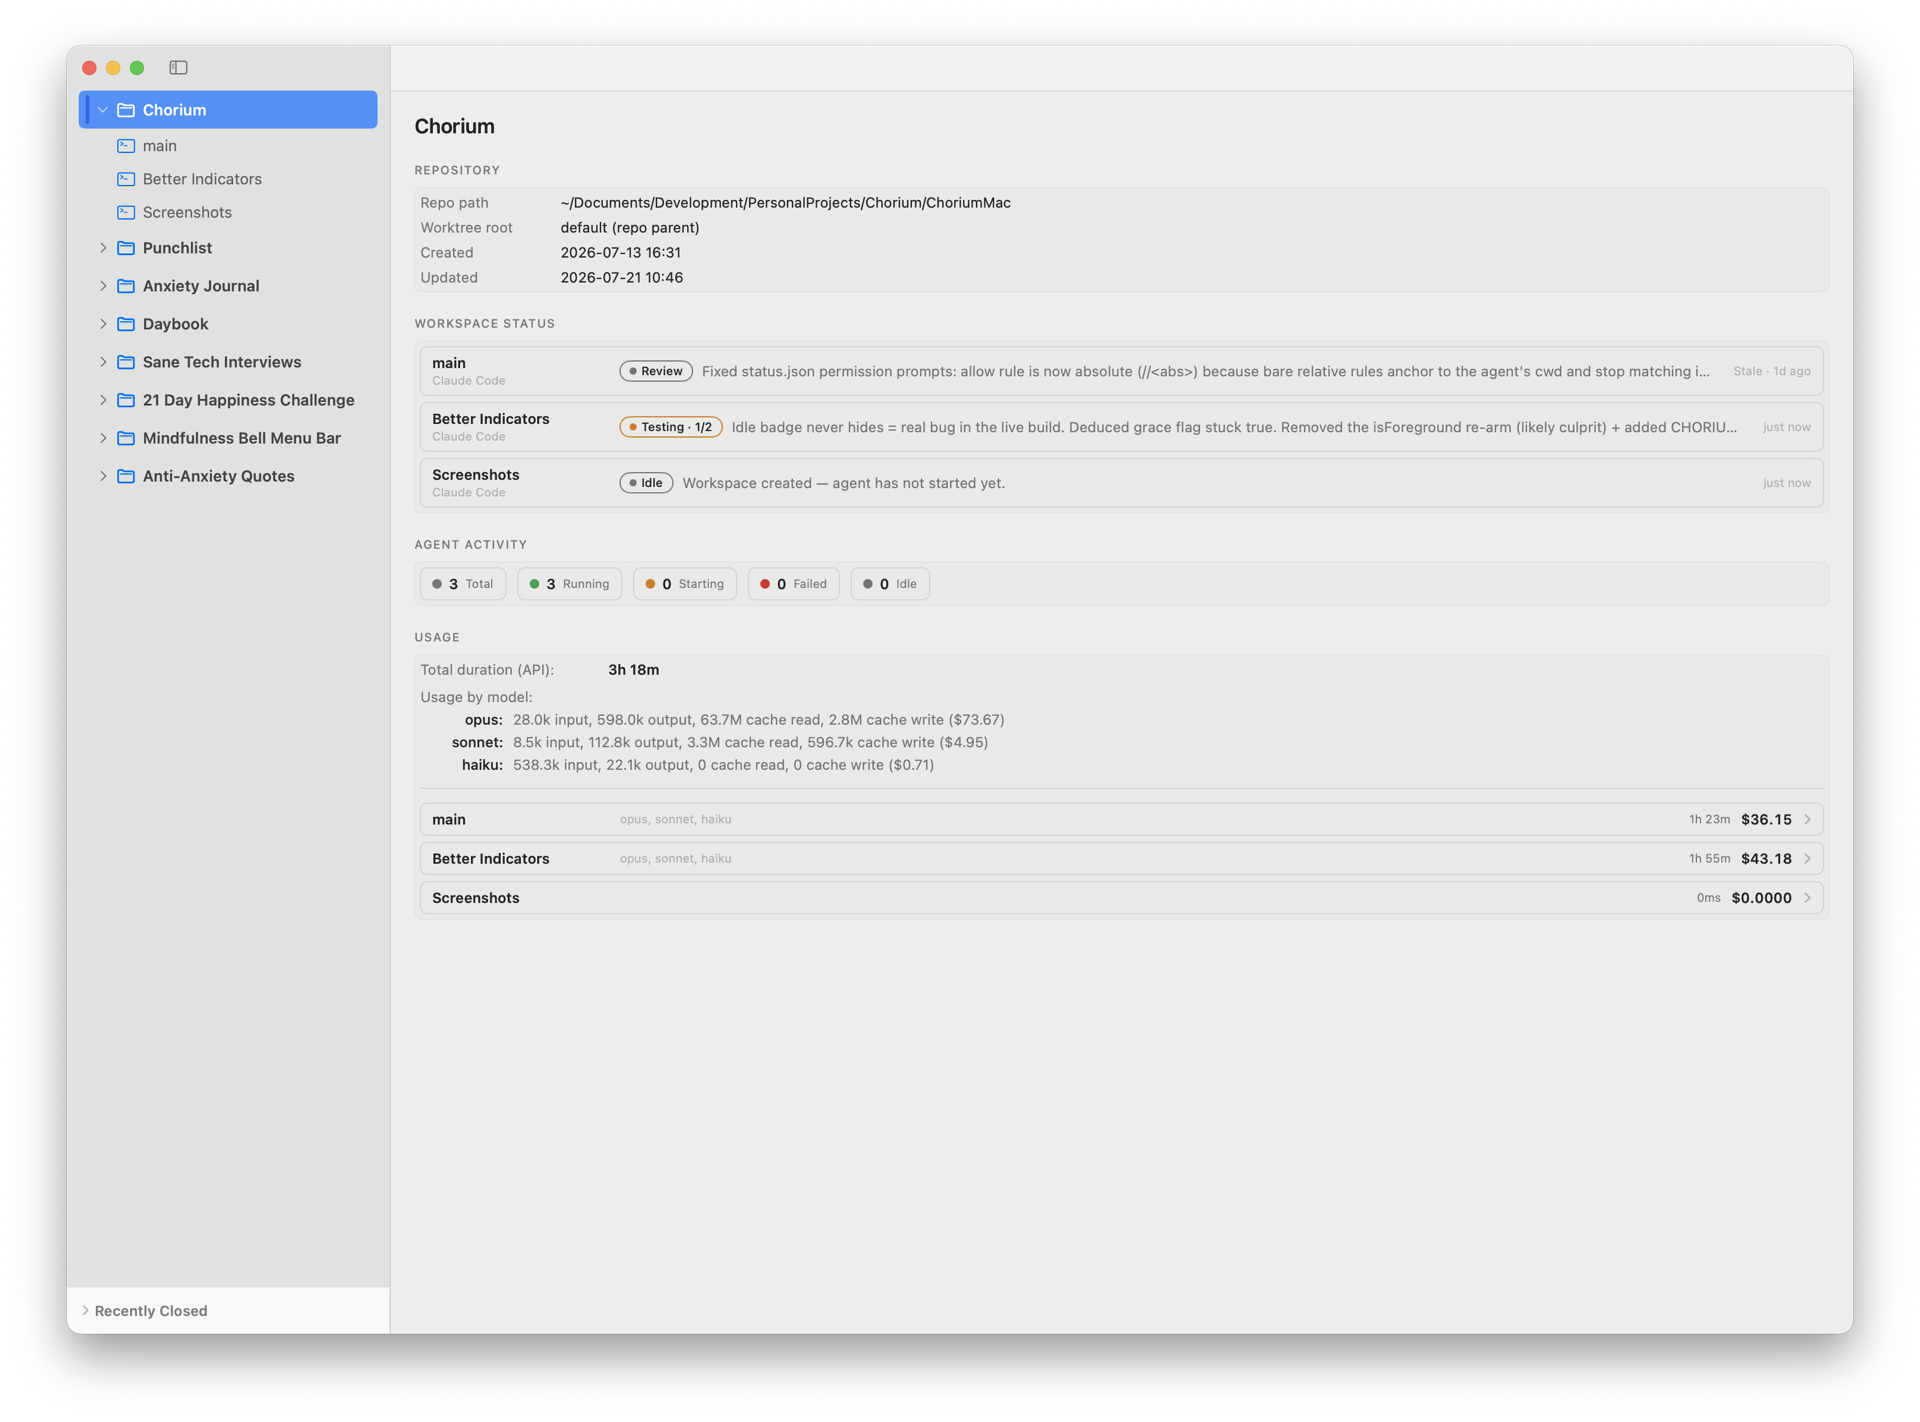
The live status sidebar
Every workspace shows a live row of status, kept current by the agent as it works. Each row tells you:
- The phase — a color-coded chip: idle, planning, implementing, testing, review, or blocked.
- A one-line summary — what the agent is doing right now, in plain words.
- The current step — where it is in a multi-step plan, when the agent reports one.
- When it last updated — with a staleness marker if a row hasn't changed in a while, so you can spot an agent that may be stuck.
The colors follow the phase: gray for idle, amber while planning, implementing, or testing, green for review (work done), and red for blocked. New to the phases? They're defined in Core Concepts.
Attention badges
You don't need to stare at the board. Chorium flags only the workspaces that need you with a small badge:
- Question (amber) — the agent asked you something and is waiting.
- Needs input (red) — the agent hit a permission prompt or a request it can't answer on its own.
- Idle (blue clock) — the agent just finished and is resting, shown for a short grace window.
A badge clears once you open that workspace and it has your attention. The result: you look only when it matters, and glance past everything that's running fine.
Activity at a glance
Above the workspaces, a set of tiles counts the fleet: how many workspaces you have in total, and how many are running, starting, failed, or idle. It's a quick health check for everything at once.
Tracking spend
Chorium shows what your agents are costing, and how it does that depends on the agent:
- Claude Code — Chorium reports live cost per workspace, with a breakdown by model. Open Agent → Usage (⌘ U) for the detail on a focused workspace.
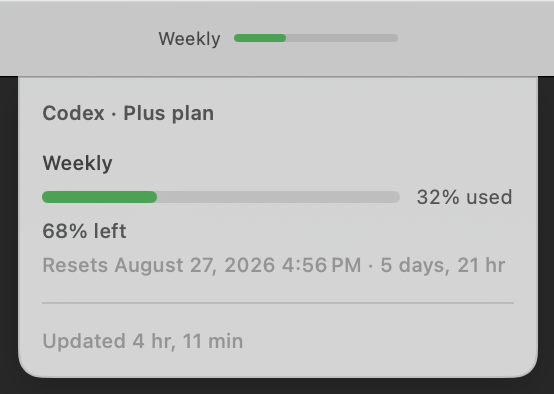
- Codex — because Codex bills against a plan rather than per request, Chorium shows an account-wide plan-usage bar in the toolbar instead of a dollar figure.
Project / Workspace (branch). Handy when several workspaces are in flight.